- Therapeutic Cataract & Refractive
- Lens Technology
- Glasses
- Ptosis
- AMD
- COVID-19
- DME
- Ocular Surface Disease
- Optic Relief
- Geographic Atrophy
- Cornea
- Conjunctivitis
- LASIK
- Myopia
- Presbyopia
- Allergy
- Nutrition
- Pediatrics
- Retina
- Cataract
- Contact Lenses
- Lid and Lash
- Dry Eye
- Glaucoma
- Refractive Surgery
- Comanagement
- Blepharitis
- OCT
- Patient Care
- Diabetic Eye Disease
- Technology
OCT is a crucial tool in glaucoma diagnosis and monitoring
Evaluating images for quality, artifacts, and segmentation errors.

")
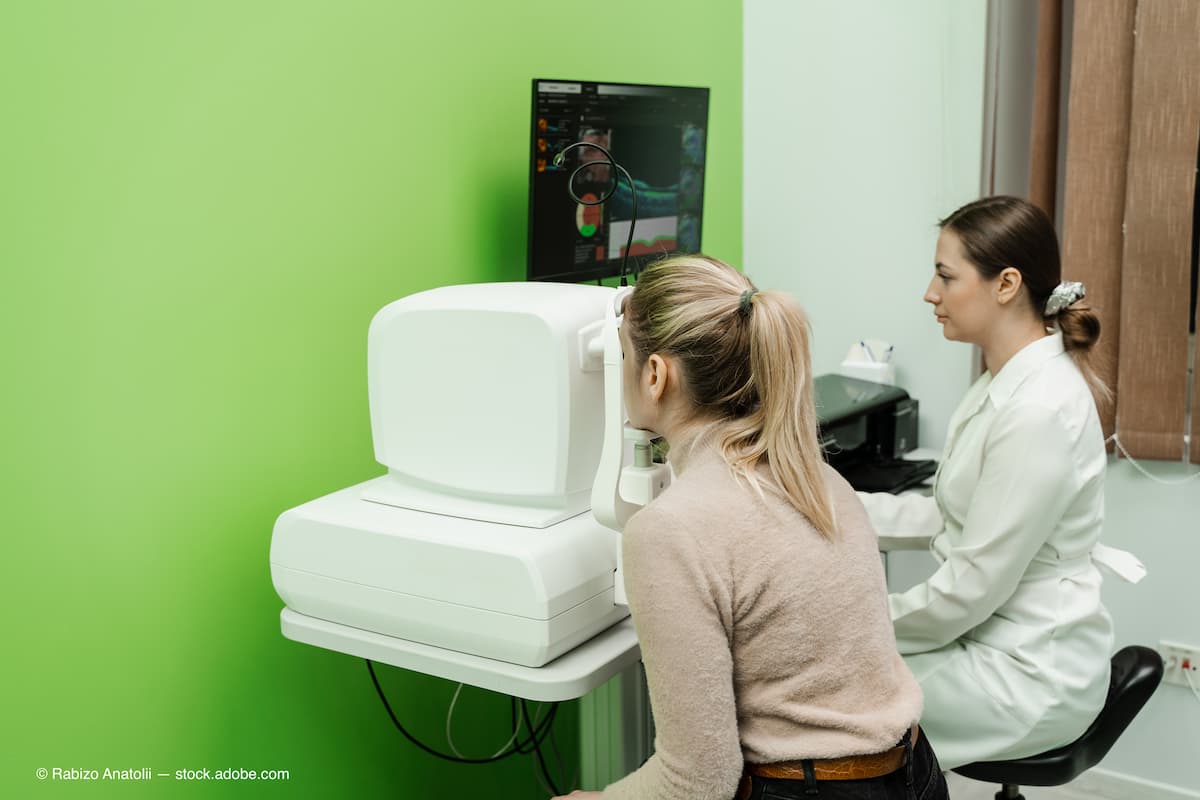
Practitioners should scan patients even when clinically obvious signs of glaucoma are absent. Often a clinically normal looking nerve can be glaucomatous, and a suspicious nerve can be normal. (Adobe Stock / Rabizo Anatolii)
When evaluating optical coherence tomography (OCT) in suspected cases of glaucoma or patients with established disease, it is crucial to obtain high-quality images to avoid inaccurate diagnoses. This means looking for the presence of artifacts, a common occurrence with retinal nerve fiber layer (RNFL) images. When reviewing the data, eye care providers should check for areas on the image that do not correlate with the clinical view of the anatomy.
It is important to review the raw data, scrolling through the individual images, to determine whether a potential artifact or segmentation error is present rather than relying on the color classification. These errors and artifacts can have an impact on clinicians’ ability to detect glaucoma, and they take on greater significance when following patients’ disease progression over the long term.
Steen’s perspective
For optimal scan quality, ensure the RNFL image is centered and look closely at the temporal superior nasal inferior temporal (TSNIT) plot to determine RNFL thickness individually and compared to the reference database. I evaluate the overall RNFL raw data to identify segmentation errors or artifacts that may affect thickness. Evaluation of the macular ganglion cell layer is complementary to RNFL analysis and is theoretically more sensitive to determine glaucomatous damage due to the high density and multilayered pattern of retinal ganglion cells that make up the ganglion cell layer (GCL).
The Spectralis (Heidelberg Engineering) with the Glaucoma Module Premium Edition (GMPE) and Hood Glaucoma Report allows us to review all information and put these data in context regarding what we may expect to see with the patient’s detectable functional damage on the visual field (Figures 1 and 2). Consider the totality of data, not just one piece of it, ensuring that the information correlates with how the patient’s anatomy appears clinically. A discrepancy between the patient’s optic nerve appearance at the slit lamp compared with a scan printout is the first red flag that there may be an artifact or a segmentation error. This means the software does not detect the retinal layer or the ganglion cell layer in which we are interested. Perhaps additional retinal layers have been included, making the layer of interest appear thicker than it is, or there could be missing pieces making it appear thinner. The first step is to repeat the scan.
Movement and disease artifacts, high myopia considerations
Eye movement or blink artifacts can create missing data; the floor effect, or the point at which no further structural loss can be detected, is also a consideration. For patients who have advanced optic nerve disease, even with further disease progression there will not be a continued reduction in the RNFL (that occurs at about 50-60 µm of overall thickness).
Significant dry eye disease or cataracts can affect overall scan quality, so we look at the platform’s built-in quality score as a general marker. Other disease states like vitreopapillary traction, posterior uveitis, and inflammation can cause the RNFL thickness to look thicker. A posterior vitreous detachment can create a shadow over the retina or the optic nerve that causes missing data.
In patients with high myopia, we classically see a temporal shift of the RNFL’s peak. Shift of the RNFL humps within a circumpapillary RNFL (cpRNFL) scan is usually attributed to variation in distribution of normal retinal vasculature. For patients who fall outside the typical normative database, we must compare our suspicion of disease to clinically objective measures and functional measures (ie, optic disc appearance and visual fields). OCT is essential when it comes to following those patients over time to check for change or progression compared with their baseline.
Although yearly OCT aligns with insurance coverage, we are learning that we should be scanning more frequently to detect progression in patients with open-angle glaucoma. Instead of performing 1 RNFL scan and 1 posterior pole scan to evaluate the ganglion cell layer during a visit, recent information suggests we might consider doing 3 or 4 scans at that first visit.1 This could reduce the interscan and patient variability and may improve our ability to detect clinically meaningful change earlier.
I value the ease of evaluating the RNFL thickness using raw data that our OCT provides. It allows me to quickly identify an error in segmentation so I can rescan or easily manipulate the RNFL thickness manually at the device. I appreciate that ability. It is vital to look at the totality of the data on the viewing station itself rather than just the printout. Scrolling through all the images is the best way of understanding the information.
Kasanoff’s perspective
I scan all my patients using SD-OCT, and I try to screen as many patients as possible. I start with a single RNFL circle scan and a macular scan. If I see anything suspicious structurally, I switch to the GMPE for a more concise impression. This way, I can target common artifacts that show up while I am watching the B-scan acquisition.
The No. 1 artifact I see is shifted TSNIT curves due to anatomical variation in peripapillary vasculature and increased axial length. Borderline and/or outside normal results will occur on the 6-sector Garway-Heath analysis when the TSNIT curve does not line up with the reference database average thickness curve. Evaluating the B-scans will show a healthy RNFL.
Another common issue with OCT interpretation involves focal RNFL defects. In this case, an outside normal RNFL deficit on the TSNIT curve and B-scans may be observed but it may be too narrow to show up on the 6-sector Garway-Heath graph delivering a false negative assessment. Look closely for wedge defects and follow them closely.
OCT interpretation in patients with high myopia is most challenging due to the following and often requires more emphasis on visual field analysis:
- Eyes above –6.00 diopter (D) sphere and/or –2.00 D cylinder are outside the reference database and results should be evaluated cautiously. The Bruch membrane opening often may not be identified, rendering the minimum rim width worthless. Even manual segmentation is sometimes impossible.
- Peripapillary atrophy often extends past the 3.5-mm circle scan causing RNFL segmentation issues. In these cases, the 4.1-mm and 4.7-mm circle scans in the GMPE are helpful in minimizing these issues.
- cpRNFL can split longitudinally and vertically, detach from the underlying GCL, and have hypodense regions all confounding the thickness measurements.
- GCL thickness maps may not be accurately acquired on severely curved posterior poles.
- Tilted discs cause deformation of the nerve, often resulting
in diffuse, outside normal, nasal RNFL readings as well as segmentation difficulties.
Previous and concurrent ocular pathologies such as branch retinal vein occlusions and nonglaucomatous optic neuropathies can masquerade as glaucoma, whereas neurologic diseases such as multiple sclerosis, neuromyelitis optica, and Alzheimer disease can confound the GCL thickness readings. Two more common confounding factors in OCT interpretation are epiretinal membranes and peripapillary/buried nerve head drusen, both revealing confusing RNFL and GCL results. See the examples and OCT images in this article. Preexisting conditions like cataracts and dry eye usually do not present a problem, although a large, dense vitreous floater can affect the RNFL and GCL readings.
When determining whether there is progression, I like to see at least 5 data points and a significant negative slope, ensuring the nerve loss exceeds what is expected from normal aging. My impression is based on several clinical and OCT puzzle pieces defining characteristic glaucomatous patterns including the above confounding factors.
The timing of follow-up scans is determined by several factors. If the patient has outside normal inferior temporal RNFL loss and corresponding thinning of GCL, I will repeat scans in 3 to 6 months depending on case specifics. For borderline patients that do not raise suspicion, yearly follow-up scans are appropriate.
It is not difficult to identify moderate to advanced glaucoma. It is more challenging to detect early disease, which is where the GMPE becomes invaluable. Many early glaucoma cases are preperimetric. The goal is to identify glaucoma before it becomes perimetric.


Practitioners should scan patients even when clinically obvious signs of glaucoma are absent. Often a clinically normal looking nerve can be glaucomatous, and a suspicious nerve can be normal. Use the GMPE to sort out these cases. Remember, half the persons who have glaucoma do not know they have it,2 so we clearly need to do a better job of detection when these patients are in our chairs. Avoiding unnecessary referrals due to false positive readings improves your professional stature with secondary and tertiary care providers, saves your patients time and money, reduces the financial burden on the health care system, and keeps the patient in your practice.
References
1. Bradley C, Hou K, Herbert P, et al. Evidence-based guidelines for the number of peripapillary OCT scans needed to detect glaucoma worsening. Ophthalmology. 2023;130(1):39-47. doi:10.1016/j.ophtha.2022.07.025
2. Don’t let glaucoma steal your sight. CDC. November 24, 2020. Accessed April 27, 2023. https://www.cdc.gov/visionhealth/resources/features/glaucoma-awareness.html

")
 Julia Amaral)")
")
")
")

")
")
")
")
")