Unlock the secrets of the myopic eye
What axial length readings and crystalline lens power tell you.


Image Credit: AdobeStock/mik_cz

Determining the refractive error of the eye is a fundamental measurement routinely performed by eye care specialists. Refractive values are required for almost every patient consultation in clinical practice. Any choice of glasses, contact lenses, or refractive surgery must be based on an accurate refractive measurement to achieve a good outcome for the patient. All treatment must compensate for the refractive error to achieve the best possible visual acuity. The results describe the refractive error of the entire ocular system, but they do not identify the origin of the ametropia. In principle, the eye has several refractive components: corneal power, crystalline lens power, and axial length. Gullstrand Refractive Analysis System (GRAS) analyzes the refraction not only for the system as a whole; it also differentiates between the most important refractive components, thus providing an extended analysis of the human eye. This study explains the GRAS method and introduces a road map of how to interpret the outcome in clinical practice, including in case reports.
Method summary
GRAS, which is available in the myopia software of Myopia Master, describes refractive changes based on the refractive components of the eye relative to the Gullstrand eye. The Gullstrand eye is the most widely used eye model and is accepted as representative of the average human eye and a valid basis for other eye models.1-3 GRAS compares individual measured parameters with the Gullstrand eye and simulates the corresponding refractive changes in the spectacle plane.
Deviation calculation of axial length, corneal power, crystalline lens power, and total refraction


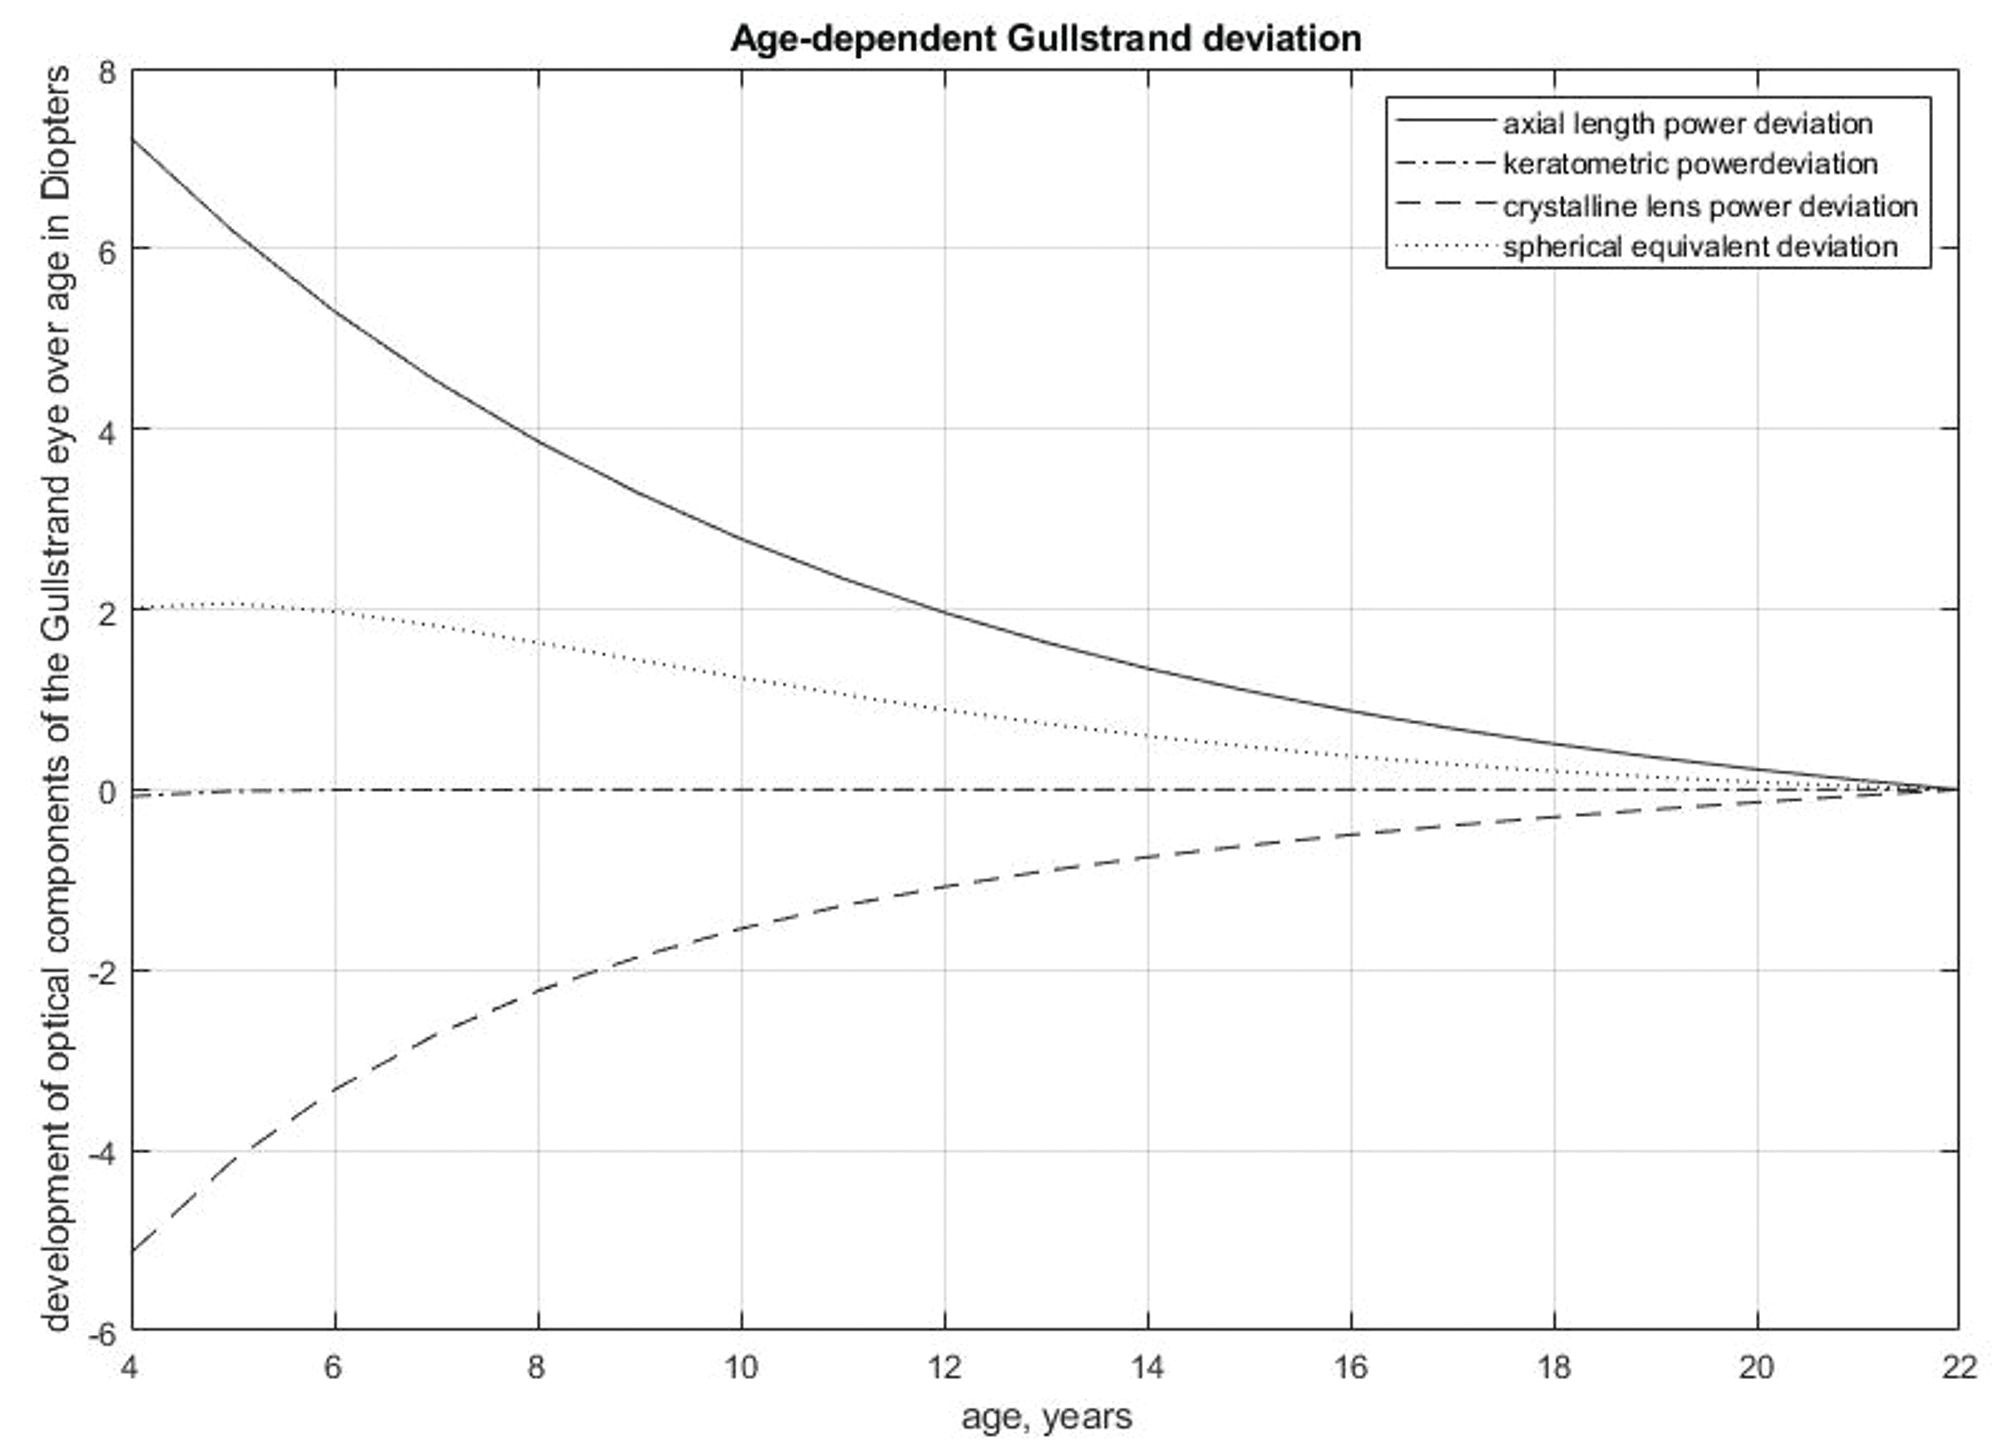
Figure 1. Development of refractive components of the Gullstrand eye over age.
- Ray-tracing simulation (in Gaussian space) was performed with the Gullstrand eye using a spectacle lens placed in front of the eye. As the Gullstrand eye is emmetropic, the spectacle lens has a refractive power of 0.
- In a GRAS examination, the Gullstrand parameters are replaced by individual measurements of axial length, corneal radius, and total refraction. The ratio of the anterior and posterior corneal curvature in the Gullstrand eye is used to calculate the posterior corneal curvature of the eye being examined. The missing crystalline lens parameters can be calculated via ray tracing in the Gaussian space. The outcome is not interchangeable with the output of an intraocular lens (IOL) formula because of the differences in geometry between IOLs and the natural crystalline lens. The validation and comparison of the GRAS results with an IOL formula are presented below.
- Each of the measured parameters, their interrelations, and the calculated crystalline lens power, explained in step 2, are inserted into the original Gullstrand eye model. Paraxial ray-tracing simulation identifies the refractive change in diopters in the spectacle lens for each component, respectively. This deviation follows the equation ∆SEQ= ∆AXL+ ∆CL+ ∆CR where ΔSEQ is the deviation in spherical equivalent, ΔAXL is the deviation in axial length, ΔCL is the deviation in crystalline lens power, and ΔCR is the deviation in corneal power.
- The refractive development of the eye depends on sex4,5 ethnicity,5 myopia onset,6 environmental factors,7-12 genetics, and other factors.12-15 Between the age of 6 and 15 years, the axial length of the eye increases by about 1 mm per year, crystalline lens power decreases by about 3 D, and corneal power remains stable.16 For this reason, the Gullstrand model works for adults but not for individuals younger than 22 years. A correction model for children was established using 7628 eyes in total, with 6029 eyes from individuals aged 4 to 21 years and 1599 eyes from participants aged 22 to 60 years. Figure 1 presents the age-dependent deviation of each parameter from the Gullstrand eye.
Comparison between crystalline lens power calculation and Haigis IOL formula


Figure 2. Bland-Altman diagram showing the difference between Gullstrand crystalline lens power calculation and Haigis IOL power.
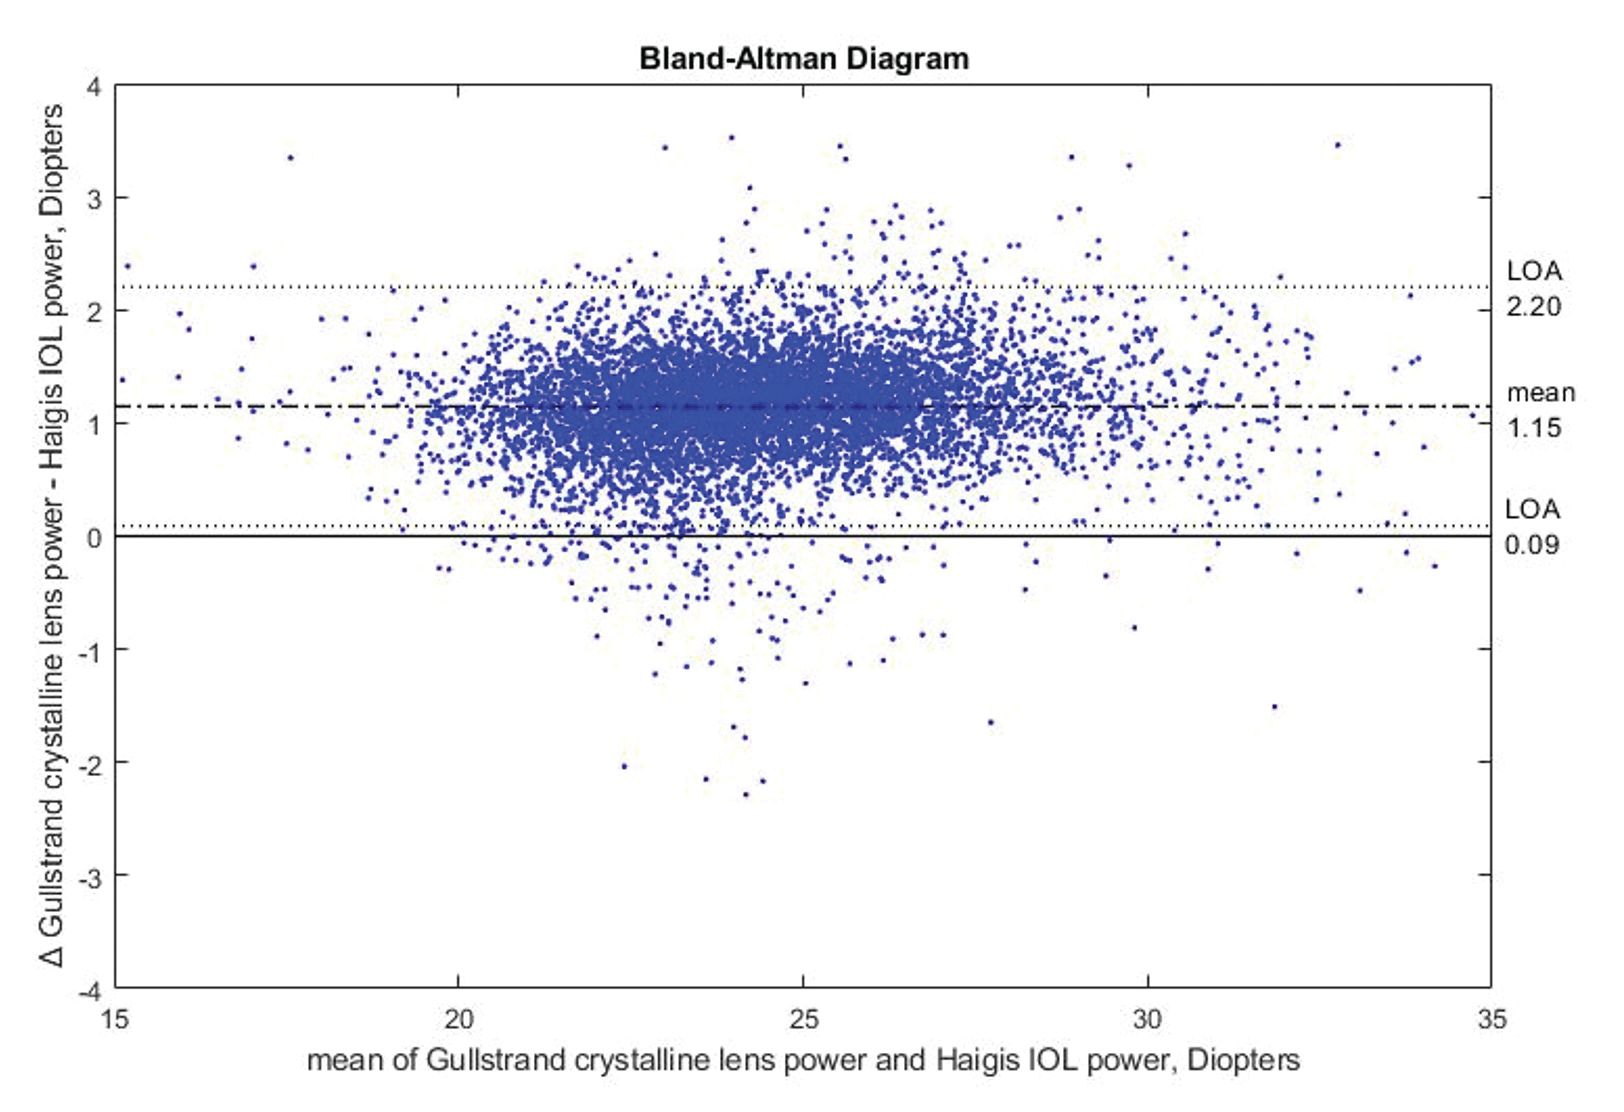
The Haigis IOL power calculation formula was used to validate the Gullstrand crystalline lens power calculation because it is the best predictive IOL formula for children’s eyes.17 The validation data set includes 7628 eyes in total, with 6029 eyes from individuals aged 4 to 21 years and 1599 eyes from participants aged 22 to 60 years.
The correlation between the Gullstrand crystalline lens power calculation and Haigis IOL power was determined as R2 = 0.9511, with an offset between the 2 models as shown in the Bland-Altman diagram in Figure 2. This offset can be explained by differences in geometry between the crystalline lens and IOL. The average thickness of an IOL is approximately 0.8 mm, whereas thickness of the crystalline lens is approximately 3.6 mm. Depending on the model, the location of the principal planes shifts, resulting in an offset in refractive power.
Clinical use
Identifying potential factors that can reduce a patient’s visual performance is an important task in clinical practice. For this purpose, it is essential to find out whether the performance reduction is caused by a general dysfunction of the visual system or by specific disparities in the eye’s dimensions that lead to defocus and blurred images on the retina. Examples of a local cause of defocus include irregularities of the refractive media in the cornea or crystalline lens. This may occur through pathological changes such as corneal ectasia or opacities in the cornea and/or crystalline lens.
Dysfunction of the visual system and reduced visual performance may furthermore be due to disturbances of the tear film or neurological causes such as amblyopia. These problems will not be discussed in detail here. Disregarding changes in the refractive media, cornea, and crystalline lens for the moment, defocus of the retinal image can also be caused by a disproportion between the refractive power of the crystalline lens and the axial length of the eye. Excessive refractive power of the cornea or the crystalline lens causes refractive myopia. Retinal defocus due to axial length elongation is called axial myopia.
Since these 2 forms of myopia have different consequences for the development of degenerative changes in the retina, it is important to know which type of myopia is present. It is also important to distinguish between axial myopia and refractive myopia, as axial length growth during the developmental period can be influenced by changes in lifestyle and optical interventions. All these factors must be thoroughly examined in determining the causes of image defocus and suitable options for their treatment.
Interpretation guide
Myopic axial length
Cause: Axial length increases during childhood. Axial growth is faster in axial myopia than it is in an emmetropic eye. Possible causes of excessive longitudinal growth include hyperopic defocus,18,19 environmental influences, and genetic disposition. The goal of myopia control is to slow down the eye’s longitudinal growth to that of an emmetropic eye.
Progression: Juvenile axial length growth is normal if it remains within physiological bounds. The older the patient, the lower the yearly growth rate. The most rapid change
in axial length occurs in the year before myopia onset.
Further investigations: Check binocular vision and accommodation. Examine the retina for pathological risk factors.
Treatment: Myopia management treatment options such as orthokeratology, multifocal contact lenses, atropine, and special spectacle lenses can reduce excessive longitudinal eye growth.
Hyperopic axial length
Cause: In early childhood, the eye is usually hyperopic and then gradually becomes emmetropic over the years. A eye that is too short can be caused by a disorder in the emmetropization process when the eye stops growing while still hyperopic. Other factors that may prematurely halt axial growth include amblyopia, strabismus, and anisometropia.
Further investigations: Check binocular vision function.
Treatment: Research is focused more on myopia management than on hyperopia management. At this time, treatments for hyperopia management are not well researched.
Myopic keratometry
Cause: In normal physiological development, corneal curvature progresses until about the second year of life and then remains relatively stable. Corneal myopia is caused by steep corneal radii, a condition that may be physiological or pathological. In pathological cases such as keratoconus or after corneal surgery, an excessively steep cornea may lead to high myopia.
Further investigations: Perform corneal topography, Scheimpflug tomography, and measurement of corneal biomechanical parameters to exclude pathological disorders.
Treatment: If corneal radii progression is pathological, it may be necessary to reduce the progression therapeutically (eg, by cross-linking). If myopia progression results from physiological keratometric changes and is not caused by longitudinal growth, shifting the image plane toward the retinal plane will not compensate for the change in refraction. Thus, peripheral defocus-changing myopia management options may not be as effective.
Hyperopic keratometry
Cause: In normal physiological development, corneal curvature progresses until about the second year of life and then remains relatively stable. Corneal hyperopia is caused by flat corneal radii. Flat corneal radii may be physiological or result from corneal surgery.
Further investigations: A myopic eye with a hyperopic cornea usually has a greater axial length than one with a myopic cornea. Particular attention to axial length and possibly associated secondary pathological complications is therefore merited. This is also important in eyes with moderate myopia or in eyes after corneal refractive surgery (eg, laser vision correction, cataract) or orthokeratology.
Treatment: Because progressive flattening of the cornea does not usually occur, there are no primary treatment options available.
Myopic crystalline lens power
Cause: Crystalline lens power decreases during childhood, compensating for longitudinal growth. Myopic lens power can be physiological, pathological (eg, cataract), or the result of accommodation.
Further investigations: Check binocular vision and accommodation to exclude pseudomyopia or nearwork-induced transient myopia. If necessary, perform a cycloplegic refraction. Check crystalline lens densitometry to exclude cataract.
Treatment: If the eye is accommodated, vision therapy procedures for disaccommodation or plus lens addition to reduce accommodative effort during nearwork may be effective. When myopia progression is caused by an accommodated eye and not by axial length growth, the location of the image in the peripheral retinal area does not affect a refractive change. Thus, if the crystalline lens is responsible for myopia progression, peripheral defocus-changing myopia management options may not be as effective.
Hyperopic crystalline lens power
Cause: Crystalline lens power decreases during childhood, compensating for longitudinal growth. Changes in crystalline lens power may promote hyperopia.
Further investigations: An eye with a hyperopic crystalline lens tends to have a greater axial length than one with a myopic crystalline lens. Particular attention to axial length and possibly associated secondary pathological complications is therefore merited. This is also important for eyes with moderate myopia.
Treatment: Because progressive hyperopia of the crystalline lens does not usually occur, there are currently no primary treatment options available.
How to read the Myopia Master software
Figure 3. Display of Myopia Master parameters.
Figure 3.Display of Myopia Master GRAS (top) and BHVI growth curves (bottom). (All figures courtesy of Philipp Hessler, PhD)
The following introduction on how to check the Myopia Master readings is based on real eye measurements. Figure 3 shows a close to ideal situation in terms of refractive error in a 12-year-old patient.
Before data analysis, measurement quality must be checked. Axial length will only show up if at least 2 successful measurements have been performed with a signal-noise ratio greater than 4.5. The higher the value, the better the signal compared with the noise. The quality of refraction and keratometry is monitored on a point scale, where 7 to 9 stands for a good measurement, 6 for moderate, and 1 to 5 for poor quality.
In the left column, it can be seen that autorefraction (2) is close to 0 in the right eye ( –0.17 D) whereas the corneal refractive value (3) is slightly below average (42.9 D, OD). This eye has a normal axial length (1) (23.38 mm, OD), and a refraction close to emmetropia would therefore be expected.
The GRAS display reveals that corneal power (5) is slightly below average, contributing OD +0.34 D to the total refractive error. Axial length (4) acts as a slightly myopic factor in the right eye (–0.35 D), whereas the lens power deviation (6) contributes to myopia (–0.93 D, OD). If we only considered axial length and keratometric deviation, we would expect emmetropia.
But why is the measured refraction (2) not equal to the GRAS refraction (7) in children when it is equal for adults? The Gullstrand eye is emmetropic; thus, the refractive outcome (SEQ) is equal to the measured refraction.


In growing individuals, the Gullstrand eye cannot be used because the age-compensated Gullstrand eye must be the reference (4). For this reason, the refractive outcome (SEQ) for a child’s eye will always appear more myopic in the GRAS display. For example, a 6-year-old child should have +2.0 D hyperopia, so if the measured refraction is +0.5 D, GRAS will show the child to have –1.5 D more myopia than normal for their age.
References
Atchison DA. Optical models for human myopic eyes. Vision Res. 2006;46(14):2236-2250. doi:10.1016/j.visres.2006.01.004
Navarro R, Santamaría J, Bescós J. Accommodation-dependent model of the human eye with aspherics. J Opt Soc Am A. 1985;2(8):1273-1281. doi:10.1364/JOSAA.2.001273
Dai GM. Wavefront Optics for Vision Correction. SPIE; 2008.
Tideman JWL, Polling JR, Vingerling JR, et al. Axial length growth and the risk of developing myopia in European children. Acta Ophthalmol. 2018;96(3):301-309. doi:10.1111/aos.13603
Sanz Diez P, Yang LH, Lu MX, Wahl S, Ohlendorf A. Growth curves of myopia-related parameters to clinically monitor the refractive development in Chinese schoolchildren. Graefes Arch Clin Exp Ophthalmol. 2019;257(5):1045-1053. doi:10.1007/s00417-019-04290-6
Gifford K. Practitioner’s guide to the clinical myopia profile. Myopia Profile. Accessed April 2, 2024. https://cdn.myopiaprofile.com/wp-content/uploads/2018/06/23122606/Clinical-myopia-profile-practitioner-guide_en1.0.pdf
Wildsoet CF, Chia A, Cho P, et al. IMI - Interventions Myopia Institute: interventions for controlling myopia onset and progression report. Invest Ophthalmol Vis Sci. 2019;60(3):M106-M131. doi:10.1167/iovs.18-25958
Xiong S, Sankaridurg P, Naduvilath T, et al. Time spent in outdoor activities in relation to myopia prevention and control: a meta-analysis and systematic review. Acta Ophthalmol. 2017;95(6):551-566. doi:10.1111/aos.13403
Huang HM, Chang DST, Wu PC. The association between near work activities and myopia in children-a systematic review and meta-analysis. PLoS One. 2015;10(10):e0140419. doi:10.1371/journal.pone.0140419
Wolffsohn JS, Flitcroft DI, Gifford KL, et al. IMI - myopia control reports overview and introduction. Invest Ophthalmol Vis Sci. 2019;60(3):M1-M19. doi:10.1167/iovs.18-25980
Li SM, Li SY, Kang MT, et al; Anyang Childhood Eye Study Group. Near work related parameters and myopia in Chinese children: the Anyang Childhood Eye Study. PLoS One. 2015;10(8):e0134514. doi:10.1371/journal.pone.0134514
Mutti DO, Mitchell GL, Moeschberger ML, Jones LA, Zadnik K. Parental myopia, near work, school achievement, and children’s refraction error. Invest Ophthalmol Vis Sci. 2002;43(12):3633-3640.
Tedja MS, Haarman AEG, Meester-Smoor MA, et al; CREAM Consortium. IMI - myopia genetics report. Invest Ophthalmol Vis Sci. 2019;60(3):M89-M105. doi:10.1167/iovs.18-25965
Jones-Jordan LA, Sinnott LT, Manny RE, et al; Collaborative Longitudinal Evaluation of Ethnicity and Refractive Error (CLEERE) Study Group. Early childhood refractive error and parental history of myopia as predictors of myopia. Invest Ophthalmol Vis Sci. 2010;51(1):115-121. doi:10.1167/iovs.08-3210
Zadnik K, Sinnott LT, Cotter SA, et al; Collaborative Longitudinal Evaluation of Ethnicity and Refractive Error (CLEERE) Study Group. Prediction of juvenile-onset myopia. JAMA Ophthalmol. 2015;133(6):683-689. doi:10.1001/jamaophthalmol.2015.0471
Jones LA, Mitchell GL, Mutti DO, Hayes JR, Moeschberger ML, Zadnik K. Comparison of ocular component growth curves among refractive error groups in children. Invest Ophthalmol Vis Sci. 2005;46(7):2317-2327. doi:10.1167/iovs.04-0945
Kou J, Chang P, Lin L, Li Z, Fu Y, Zhao YE. Comparison of the accuracy of IOL power calculation formulas for pediatric eyes in children of different ages. J Ophthalmol. 2020;2020:8709375. doi:10.1155/2020/8709375
Gwiazda J, Thorn F, Bauer J, Held R. Myopic children show insufficient accommodative response to blur. Invest Ophthalmol Vis Sci. 1993;34(3):690-694.
Abbott M, Schmid KL, Strang NC. Differences in the accommodation stimulus response curves of adult myopes and emmetropes. Ophthalmic Physiol Opt. 1998;18(1):13-20. doi:10.1016/S0275-5408(97)00072-0