- July digital edition 2023
- Volume 15
- Issue 07
Study finds significant variance across imaging modalities on sizes of geographic atrophy areas
A single, consistent modality leads to better geographic atrophy tracking.
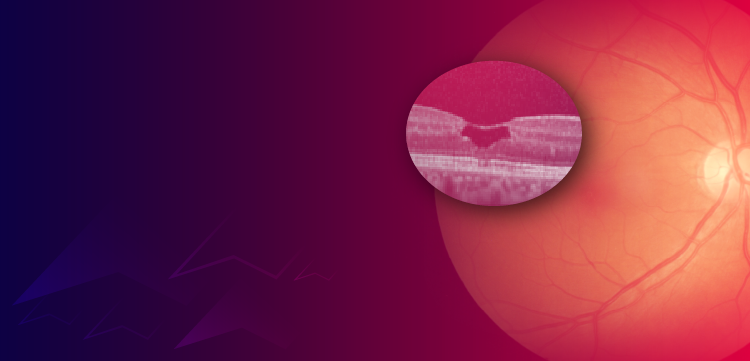
Fundus autofluorescence, a common imaging modality used to assess the retina, may be under-reporting the sizes of geographic atrophy across various phenotypic features, according to Noor Chahal, BS, who reported these findings at the 2023 Association for Research in Vision and Ophthalmology Annual Meeting.
Chahal and colleagues compared the results of
During the METforMIN clinical trial, Chahal said that he and his colleagues analyzed findings from 170 color fundus photographs, 185 fundus autofluorescence images, and 185 infrared reflectance images. The images were obtained from 128 eyes from 77 patients with GA. Two independent masked graders measured the areas of GA in the images. The fundus autofluorescence images were measured manually and semiautomatically using RegionFinder Software (Heidelberg Engineering, Inc.).
Images were then stratified based on the GA focality, homogeneity, size, and color to identify any significant differences in measurements between the semiautomatically graded fundus autofluorescence images and the other methods. Homogeneous lesions were defined as GA lesions with homogeneous hypofluorescence on fundus autofluorescence. Conversely, non-homogeneous lesions were defined as GA lesions with mixed hypo- and hyperfluorescence on fundus autofluorescence, Chahal explained.
Results of image comparisons
The measurement results of the areas of GA by modality were as follows: color fundus photographs, 9.18 ± 8.11 mm2; manually measured fundus autofluorescence images, 8.75 ± 7.32 mm2; semiautomatically graded fundus autofluorescence images, 7.02 ± 5.52 mm2; and infrared reflectance images, 8.76 ± 7.37 mm2. The investigators reported that the 4 methods had excellent intergrader agreement (intraclass correlation coefficient, > 0.99) within the same modality. The semiautomatic gradings of the fundus autofluorescence (FAF) images (7.02 ± 5.52mm2) were significantly lower than the color fundus photographs (9.18 ± 8.11mm2, P = .001), manually graded FAF (8.75 ± 7.32mm2, P = .004), and the infrared reflectance (8.76 ± 7.37mm2, P = 0.003) image measurements.
The same relationship was seen in the unifocal, multifocal, and nonhomogeneous GA lesions. However, among the 53 homogeneous GA lesions, the semiautomatically measured autofluorescence results did not differ significantly from those of the fundus photographs (difference, –0.88 ± 1.27 mm2; P = .06), manually measured autofluorescence results (difference, –0.51 ± 0.68 mm2; P = .27), and infrared reflectance results (difference, –0.45 ± 0.71 mm2; P = .21), the authors reported.
In addition, gray GA lesions (n = 5) had the highest cross-modality differences when compared to measurements obtained using semiautomated fundus autofluorescence. The measurements from the fundus photographs showed a difference of –6.29 ± 5.18 mm2. Those from the manual autofluorescence measured, –8.43 ± 1.96 mm2, and from the infrared reflectance measured, –6.41 ± 2.88 mm2.
“Although each method had excellent intergrader agreement, the GA sizes measured semiautomatically on autofluorescence images were significantly lower than in other imaging modalities,” the authors concluded. Finally, they encourage clinicians and researchers to use a single, consistent modality for disease monitoring and progression and to consider GA phenotype when interpreting imaging results.
Reference
1. Chahal, N; Shen, L L, Kennan, J, et al. Comparison of fundus photography, autofluorescence, and infrared imaging in various phenotypic features of geographic atrophy. Paper presented at: the 2023 Association for Research in Vision and Ophthalmology Annual Meeting; April 22—27, 2023; New Orleans, LA. Accessed May 23, 2023.
Articles in this issue
over 2 years ago
What is type 3 diabetes?over 2 years ago
Demodex “tails”over 2 years ago
Fitting scleral lenses for Bell palsy and Ramsay Hunt syndromeover 2 years ago
Dry eye after LASIK is a common problemNewsletter
Want more insights like this? Subscribe to Optometry Times and get clinical pearls and practice tips delivered straight to your inbox.


